
Reports & analytics
A real-time analytics system helps you accurately measure how well your connections are working.
Core metrics
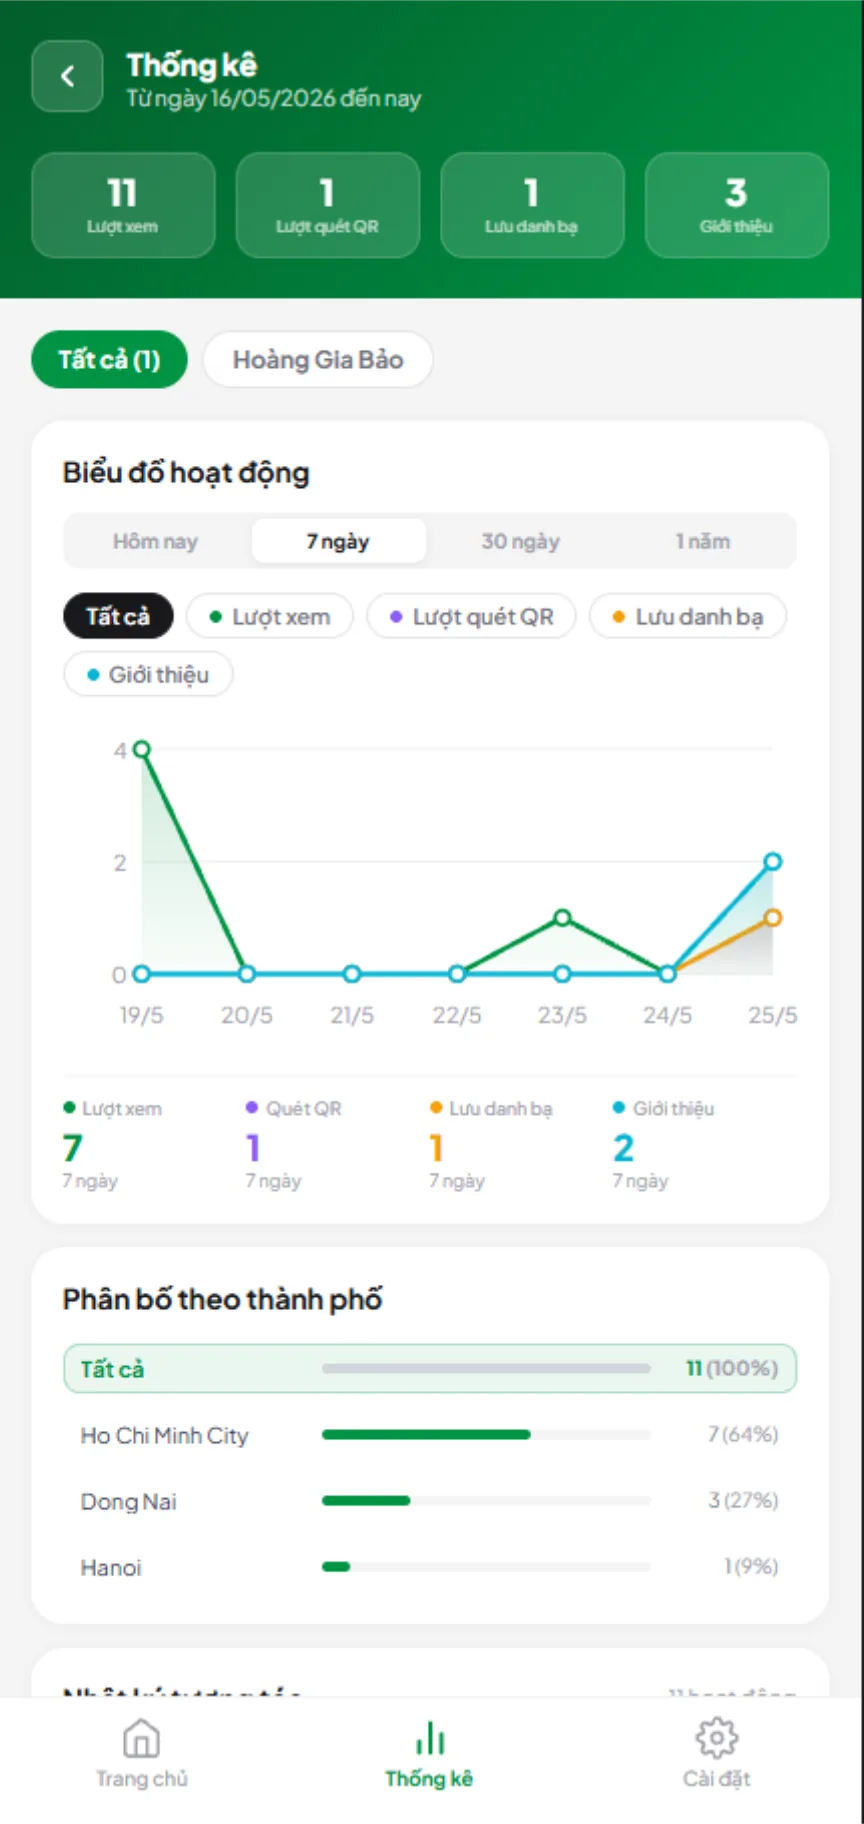
On the Statistics screen, every counter is synced directly from real data:
- Views — total times your card page was opened, with same-session reloads automatically deduplicated.
- QR scans — how many times visitors opened your card by scanning the dynamic QR code.
- Contact saves — how many times visitors saved your vCard to their phone.
- Intros — how many visitors opened your detailed About page.
Geographic stats
The system pinpoints the city and district of each visitor viewing your card. You can click a city name directly on the stats table to filter the chart and log below to just that area, and click "All" to clear the filter.
Detailed activity logs
Beyond the headline numbers, every single interaction is logged. Click any log entry to expand the details: the type of activity (view, QR scan, or contact save), the exact time, the device used (browser, OS), location, and the traffic source (QR scan, a link from Zalo/Facebook, or a direct visit).
Organization-level stats
For organization admins: a dedicated stats tab aggregates numbers across every member — total views, scans, saves, and intro page visits — plus a combined geographic distribution map and a full activity log showing exactly which member was reached. Template cards are always excluded from these counts so the numbers reflect only real interactions.